While solar power is growing at an extremely rapid clip, in absolute terms, the use of natural gas for electricity production has continued to outpace renewables. But that looks set to change in 2024, as the US Energy Information Agency (EIA) has run the numbers on the first half of the year and found that wind, solar, and batteries were each installed at a pace that dwarfs new natural gas generators. And the gap is expected to get dramatically larger before the year is over.
Solar, batteries booming
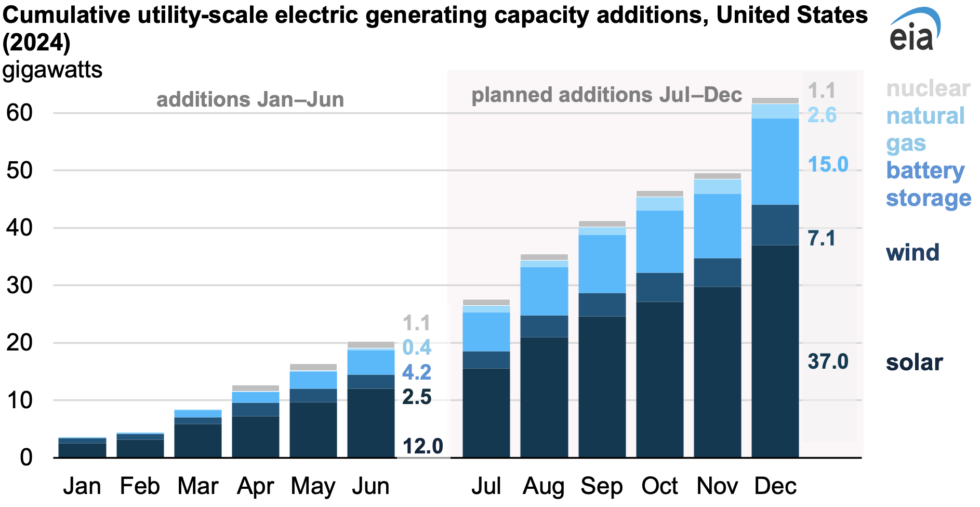
According to the EIA’s numbers, about 20 GW of new capacity was added in the first half of this year, and solar accounts for 60 percent of it. Over a third of the solar additions occurred in just two states, Texas and Florida. There were two projects that went live that were rated at over 600 MW of capacity, one in Texas, the other in Nevada.
Next up is batteries: The US saw 4.2 additional gigawatts of battery capacity during this period, meaning over 20 percent of the total new capacity. (Batteries are treated as the equivalent of a generating source by the EIA since they can dispatch electricity to the grid on demand, even if they can’t do so continuously.) Texas and California alone accounted for over 60 percent of these additions; throw in Arizona and Nevada, and you’re at 93 percent of the installed capacity.
The clear pattern here is that batteries are going where the solar is, allowing the power generated during the peak of the day to be used to meet demand after the sun sets. This will help existing solar plants avoid curtailing power production during the lower-demand periods in the spring and fall. In turn, this will improve the economic case for installing additional solar in states where its production can already regularly exceed demand.
Wind power, by contrast, is running at a more sedate pace, with only 2.5 GW of new capacity during the first six months of 2024. And for likely the last time this decade, additional nuclear power was placed on the grid, at the fourth 1.1 GW reactor (and second recent build) at the Vogtle site in Georgia. The only other additions came from natural gas-powered facilities, but these totaled just 400 MW, or just 2 percent of the total of new capacity.

The EIA has also projected capacity additions out to the end of 2024 based on what’s in the works, and the overall shape of things doesn’t change much. However, the pace of installation goes up as developers rush to get their project operational within the current tax year. The EIA expects a bit over 60 GW of new capacity to be installed by the end of the year, with 37 GW of that coming in the form of solar power. Battery growth continues at a torrid pace, with 15 GW expected, or roughly a quarter of the total capacity additions for the year.
Wind will account for 7.1 GW of new capacity, and natural gas 2.6 GW. Throw in the contribution from nuclear, and 96 percent of the capacity additions of 2024 are expected to operate without any carbon emissions. Even if you choose to ignore the battery additions, the fraction of carbon-emitting capacity added remains extremely small, at only 6 percent.
Gradual shifts on the grid
Obviously, these numbers represent the peak production of these sources. Over a year, solar produces at about 25 percent of its rated capacity in the US, and wind at about 35 percent. The former number will likely decrease over time as solar becomes inexpensive enough to make economic sense in places that don’t receive as much sunshine. By contrast, wind’s capacity factor may increase as more offshore wind farms get completed. For natural gas, many of the newer plants are being designed to operate erratically so that they can provide power when renewables are under-producing.
A clearer sense of what’s happening comes from looking at the generating sources that are being retired. The US saw 5.1 GW of capacity drop off the grid in the first half of 2024, and aside from a 0.2 GW of “other,” all of it was fossil fuel-powered, including 2.1 GW of coal capacity and 2.7 GW of natural gas. The latter includes a large 1.4 GW natural gas plant in Massachusetts.
But total retirements are expected to be just 7.5 GWO this year—less than was retired in the first half of 2023. That’s likely because the US saw electricity use rise by 5 percent in the first half of 2025, based on numbers the EIA released on Friday (note that this link will take you to more recent data a month from now). It’s unclear how much of that was due to weather—a lot of the country saw heat that likely boosted demand for air conditioning—and how much could be accounted for by rising use in data centers and for the electrification of transit and appliances.
That data release includes details on where the US got its electricity during the first half of 2024. The changes aren’t dramatic compared to where they were when we looked at things last month. Still, what has changed over the past month is good news for renewables. In May, wind and solar production were up 8.4 percent compared to the same period the year before. By June, they were up by over 12 percent.
Given the EIA’s expectations for the rest of the year, the key question is likely to be whether the pace of new solar installations is going to be enough to offset the drop in production that will occur as the US shifts to the winter months.

