Sui extends gains by 4% on Friday, after rallying nearly 14% this week. Uniswap begins recovery on Friday after nearly 8% loss in value on the weekly timeframe. The two tokens could offer higher gains to holders in the coming week.
Bitcoin eyes recovery, Sui and Uniswap could rally alongside
Bitcoin (BTC) lost nearly 3% of its value this week, the largest cryptocurrency is beginning its recovery on Friday. At the time of writing, BTC posted nearly 3% gains on the day, hovering above $94,000.
While Bitcoin eyes recovery, altcoins Sui and Uniswap show potential for gains in the coming week. SUI could extend its rally, and climb higher. Uniswap is currently erasing losses from the past week, UNI added nearly 4% value on Friday.
SUI and UNI trade at $5.0865 and $13.371 at the time of writing.
On-chain and technical indicators support gains
Uniswap’s on-chain indicators support a bullish thesis for the DeFi token. The Network realized profit/loss metric shows a slow down in profit-taking by UNI token holders in the last two weeks. Typically, as profit-taking slows down, it reduces selling pressure on the token.
The Volume is in an upward trend, between December 28 and January 10. Rising volume alongside an increase in price is conducive to gains in the token.
The UNI token supply held by large wallet investors has climbed consistently since mid-December. This supply represents UNI held outside of exchange wallets, therefore a rise in these holdings does not contribute to selling pressure. It is a sign of growing investor confidence in UNI.
The Binance funding rate has been positive consistently for nearly a month, supporting a bullish thesis for UNI price.

SUI’s trade volume is in an upward trend with tall positive spikes between December 27 and January 10. In the same timeframe, funding rates aggregated by SUI have turned positive across top exchanges and the price climbed.
The percent of stablecoin total supply held by whales with over $5 million climbed in the past three days, showing stronger demand for the token across exchanges.

What to expect from SUI and UNI next week
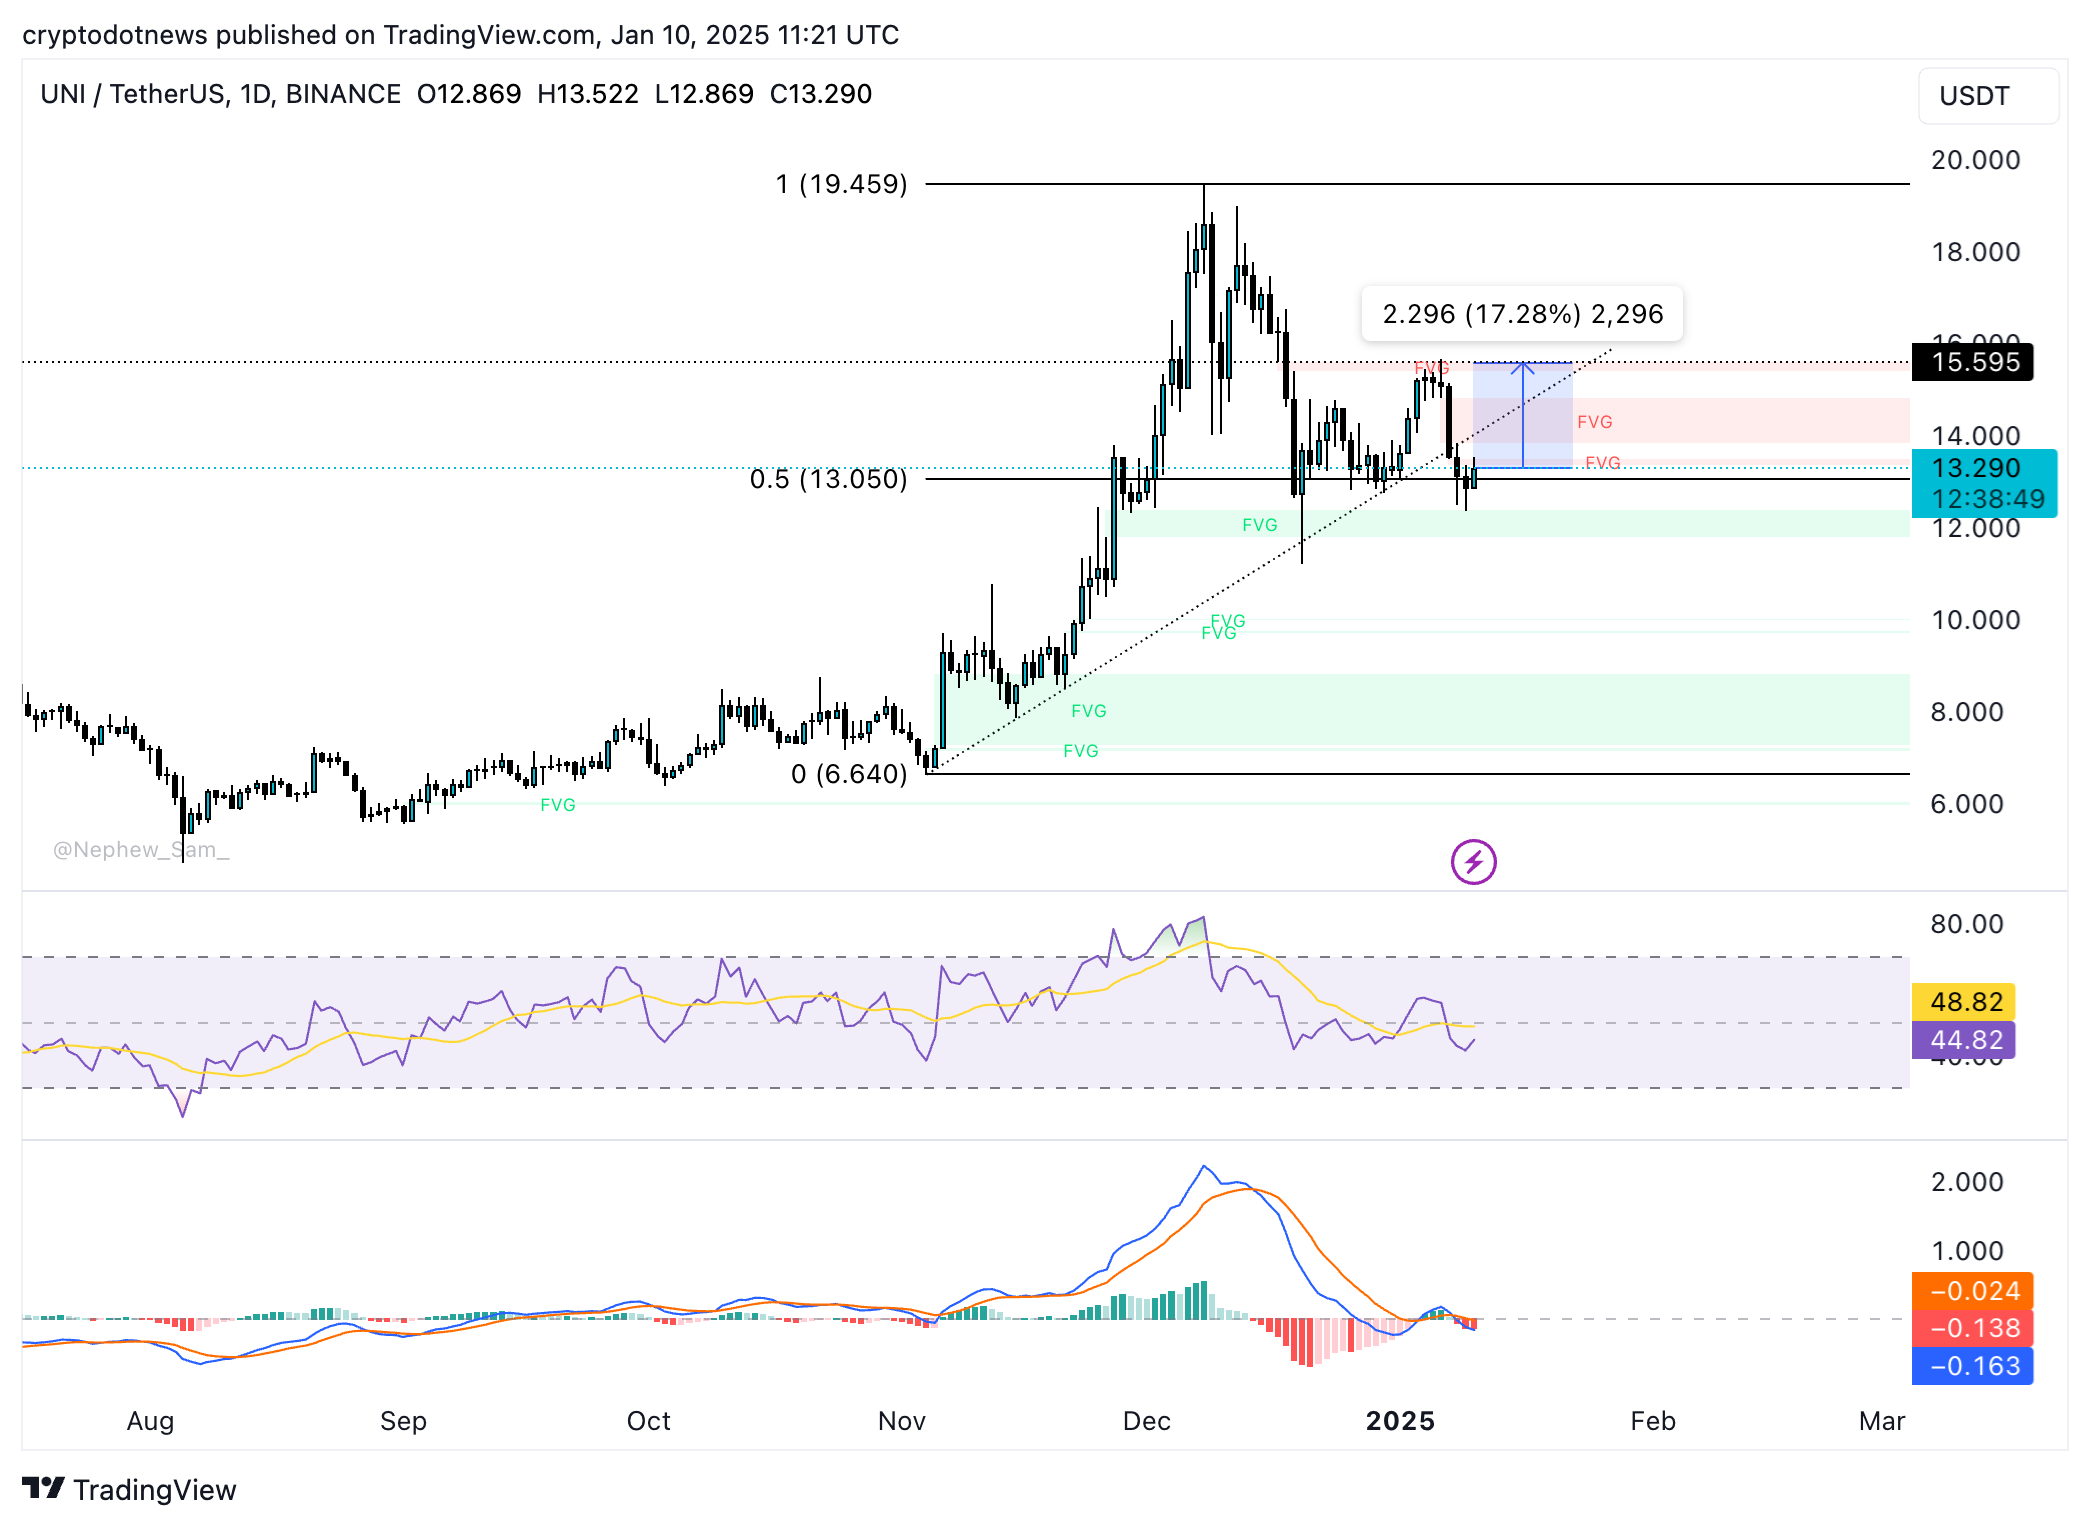
UNI is consolidating close to $13.05, the 50% Fibonacci retracement level of its rally from $6.640 to $19.459. A key technical indicator, the Relative strength index supports further gains in UNI.
RSI is sloping upwards and reads 44, close to the neutral level.
Traders need to keep their eyes peeled as the Moving average convergence divergence indicator flashes red histogram bars under the neutral line, meaning that there is underlying negative momentum in UNI price trend.
If UNI extends its gains, the DeFi token could target the January 6 high of $15.595. UNI could test resistance at $15.595, marking a 17% gain in the token’s price.

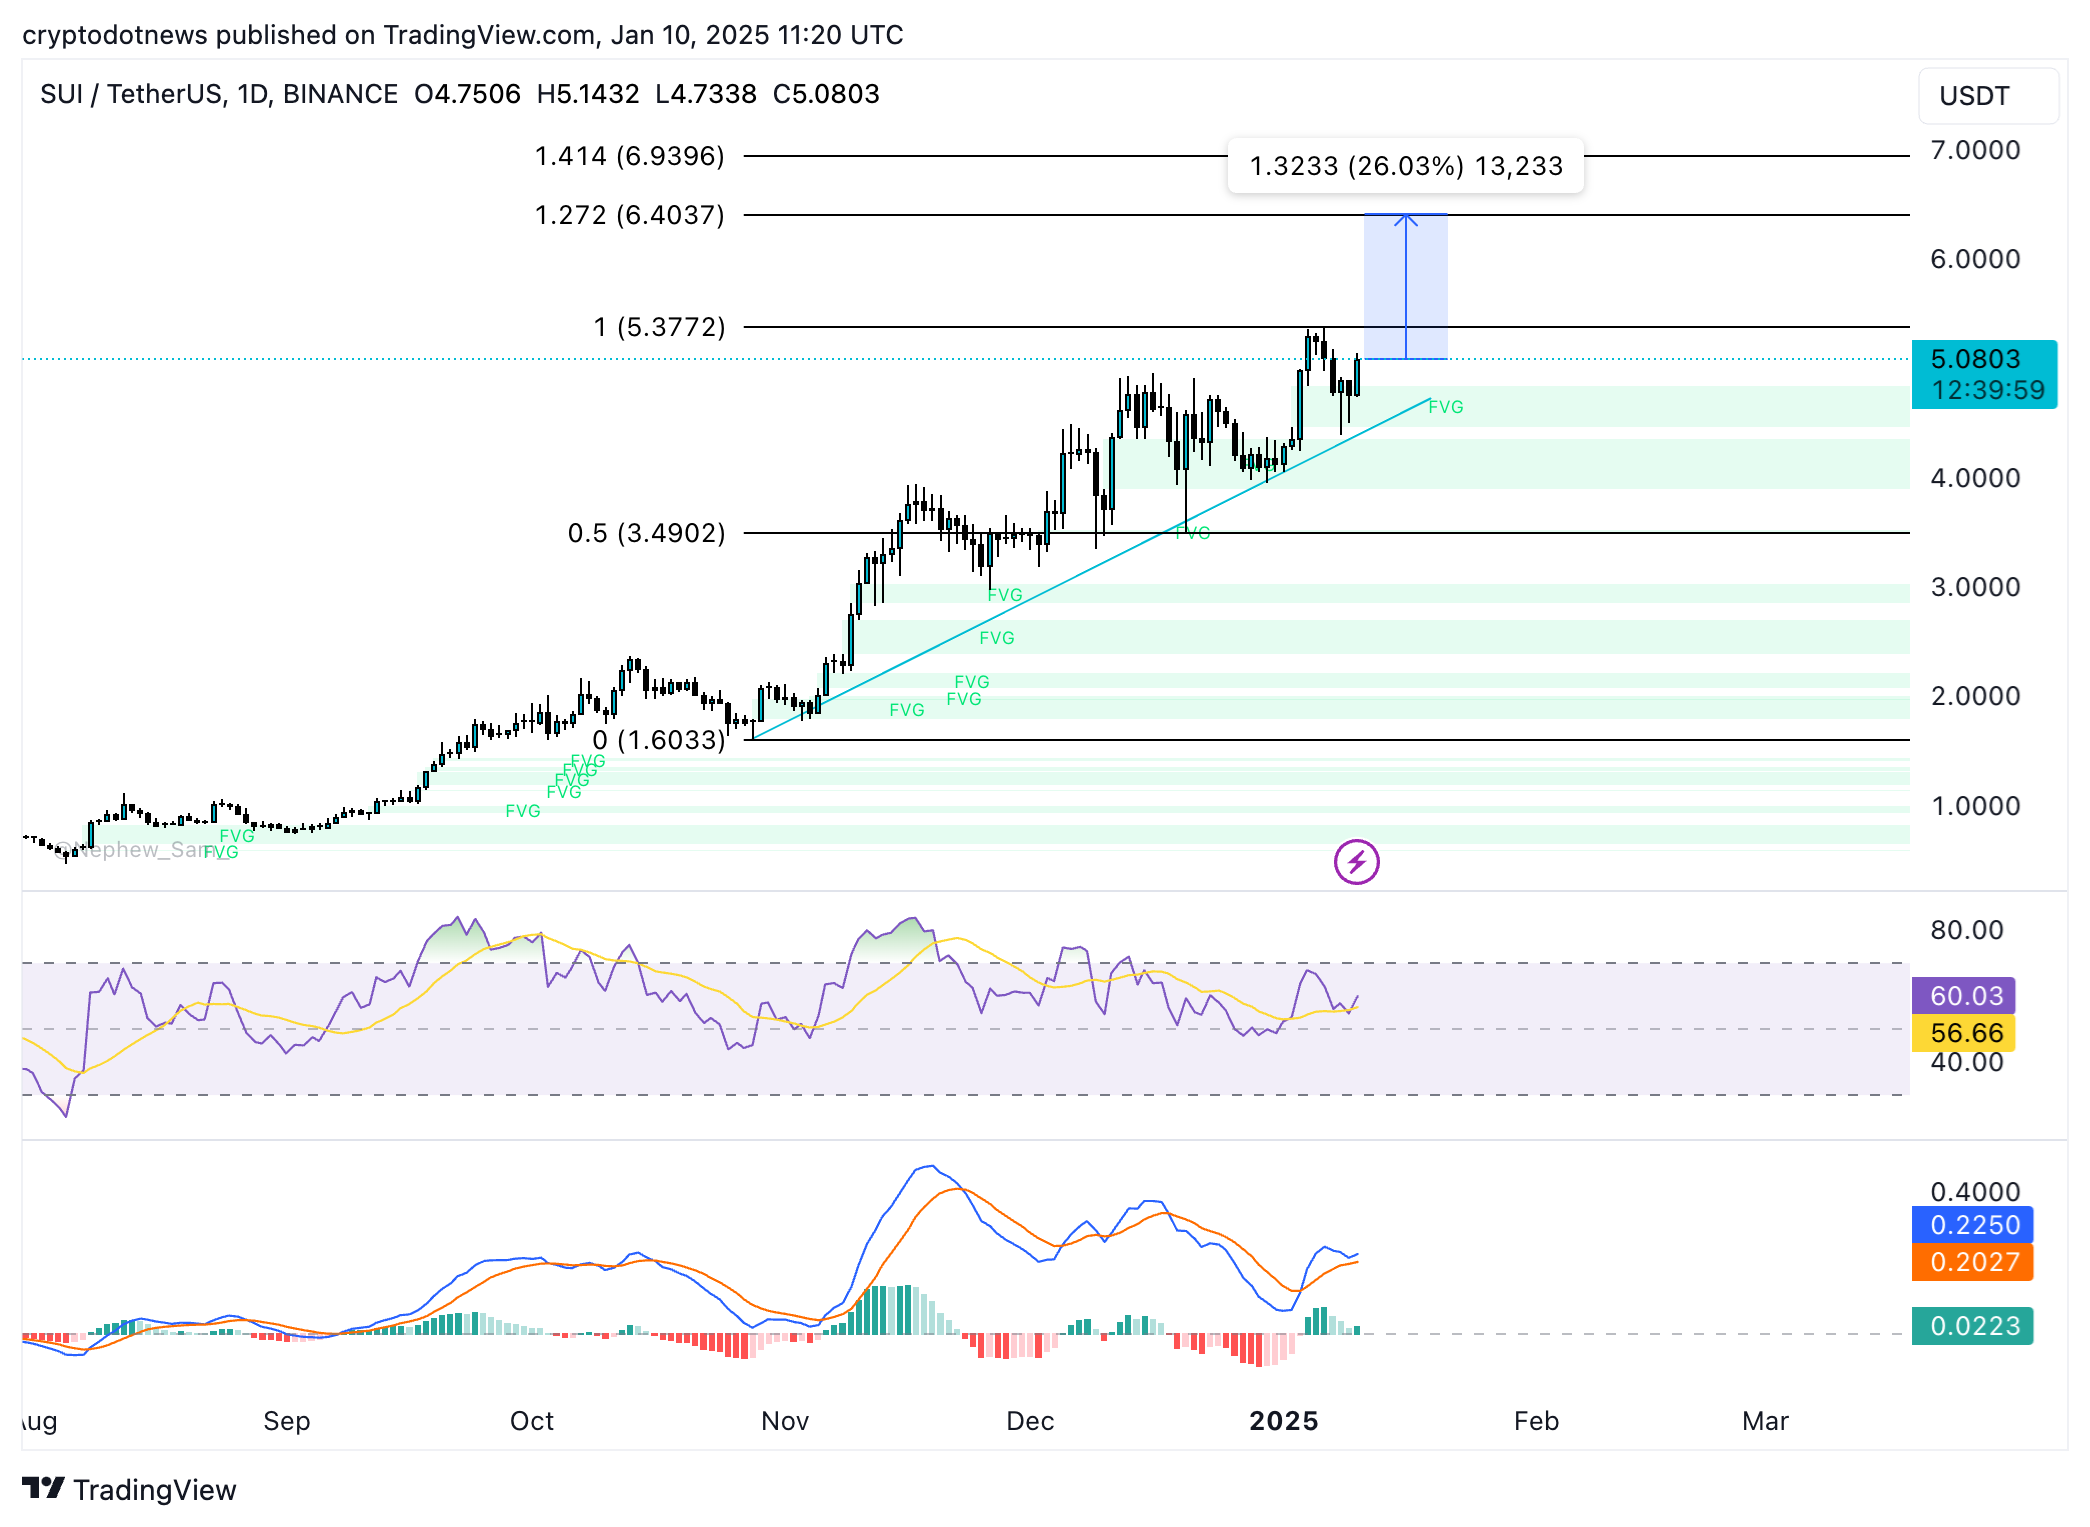
SUI is in an upward trend that started in November 2024. The token of the Layer 1 blockchain is close to its peak of $5.3772. SUI could continue its uptrend and rally towards the 127.2% Fibonacci retracement at $6.4037.
SUI could rally 26% and test resistance at $6.4037.
RSI and MACD support a bullish thesis for the Layer 1 token, RSI is sloping upwards and reads 60. MACD shows green histogram bars above the neutral line, signaling positive momentum is the underlying SUI price trend.

State of the crypto market
David Morrison, Senior Market Analyst at Trade Nation told Crypto.news in an exclusive interview,
“Bitcoin is looking a bit perkier this morning and has made back most of yesterday’s losses.”
In its market deep dive, analysts at Crypto Finance observe that:
“BTC faced another headwind this week as the US Department of Justice announced approval to liquidate 69,000 BTC seized from the Silk Road. Worth around $6.5 billion, this potential sell-off appears to have spooked traders and cleared out weaker hands. Why does this matter? The DOJ’s BTC holdings represent a significant portion of total market liquidity. In an already unstable macro environment, this news added fuel to the fire.
Despite this, BTC has held on to key support at around $92,000, but a break below this level could pave the way for a deeper pullback.”
The 24-hour liquidation in the crypto market crossed $329 million on Friday. Of this, Bitcoin accounts for over $88 million in liquidations as the largest cryptocurrency consolidates. Traders should watch the liquidations closely next week to identify whether the market improves and makes room for higher demand in crypto.
Reason for optimism as US regulatory outlook improves
David Carlisle of Elliptic explores crypto policy and regulation in his recent research at Elliptic. Carlisle notes that 2024 has been a year of important developments that will have an impact on the crypto space for years to come.
Carlisle believes that in 2025 crypto policy and regulation could make strides. In the US, banking regulators could lower barriers to engagement with crypto for financial institutions and President-elect Donald Trump’s presidency could promote a pro-crypto sentiment.
Key appointments like SEC Chair, AI & Crypto Czar, and the CFTC Chair by the incoming President could influence the regulatory and policy approaches to crypto in the US.
Ripple CEO Brad Garlinghouse recently revealed that 75% of the company’s open roles are now based in the U.S. and stated that the “Trump effect” is the driver for the firm’s decision. Growing optimism among crypto firms, and a conducive regulatory environment could support demand for crypto among U.S.-based traders.
Disclosure: This article does not represent investment advice. The content and materials featured on this page are for educational purposes only.

